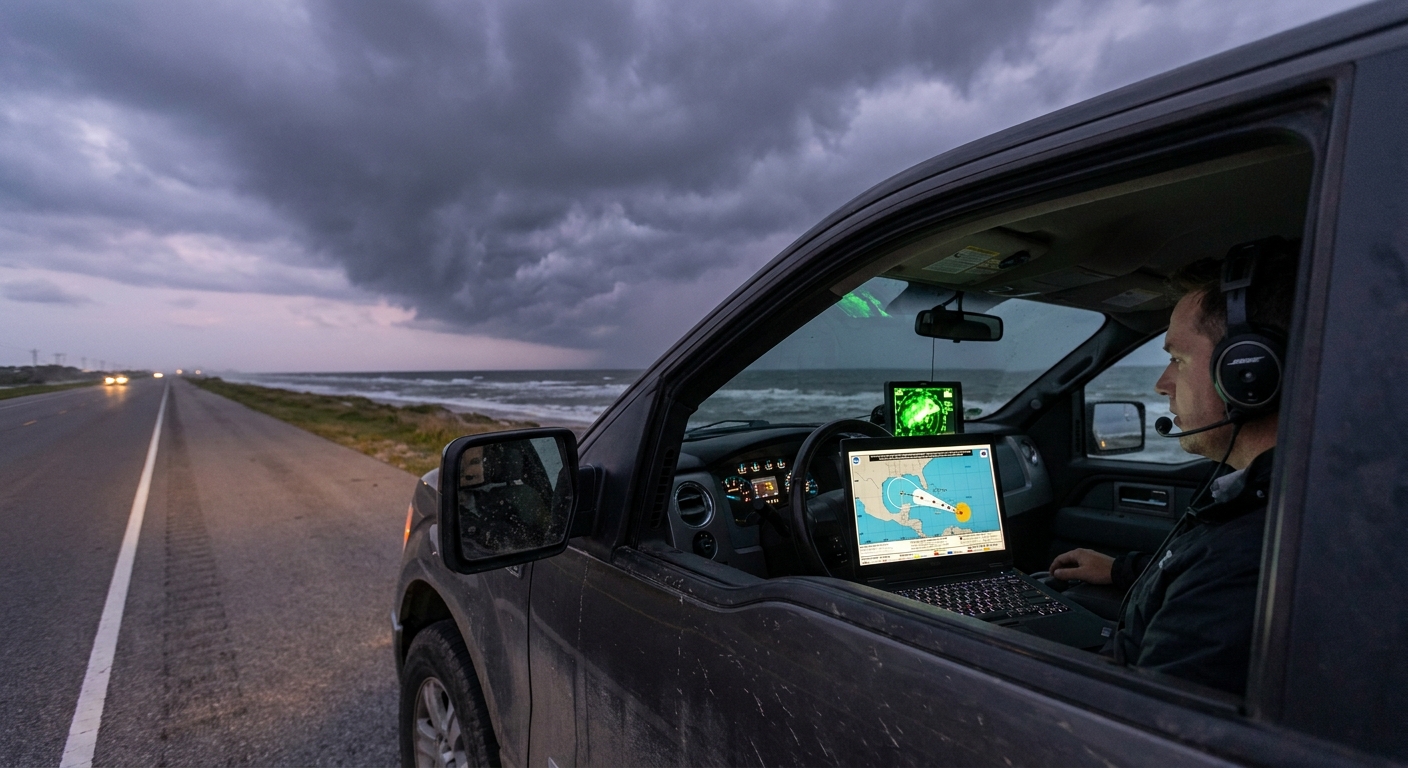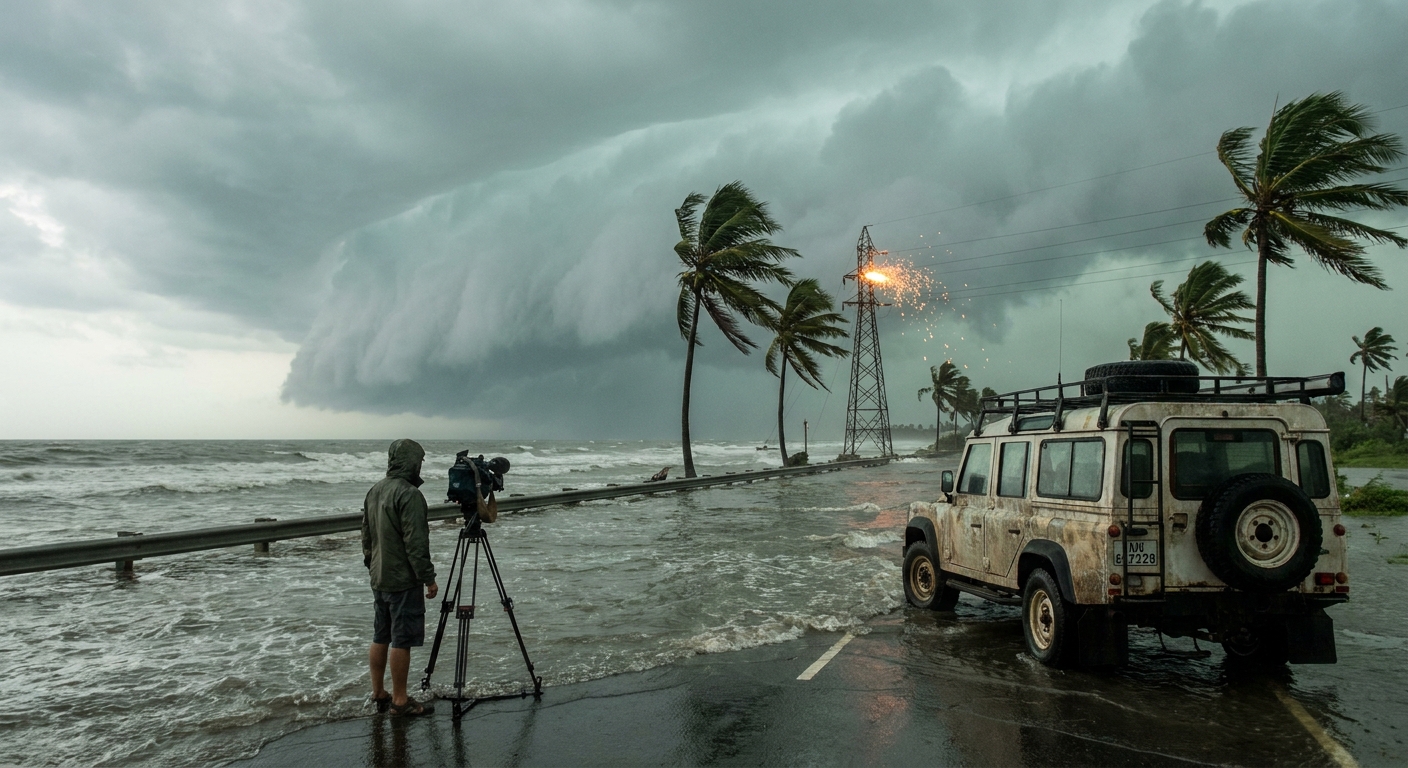
Wind-driven rain slams the windshield. The world outside is reduced to streaks of water and the sickly glow of a distant substation sparking in the distance. The only thing more intense than the roar of the wind is the silence on the radio as every chaser in the convoy stares at the same radar scan.
Nightfall on the Coast: When the Eyewall Comes Ashore
Is the core about to pass over us—or just miss us by five miles?
In those moments, hurricane tracking stops being abstract. It’s not just maps and model runs; it’s your exact latitude, your escape routes, your survival. And the only thing between you and a blind guess is radar.
The Radar Arsenal: What We Use When the Ocean Starts to Boil
Hurricane chasers live on a diet of radar products the way pilots live on instrument panels. When a cyclone edges within radar range (~250–300 km from a coastal site), we start reading its anatomy in fine detail.
Core Radar Types We Depend On
- Base Reflectivity (DBZ) – Shows precipitation intensity; helps outline rainbands, the eyewall, and convective bursts.
- Base Velocity (VEL) – Shows motion of precipitation toward/away from the radar; essential for spotting wind maxima and rotation.
- Storm-Relative Velocity (SRV) – Adjusts for storm motion to highlight rotation; used heavily for tornado-embedded rainbands.
- Composite Reflectivity – Helps reveal tall, intense cores that may hide in outer bands.
On a live chase, I keep at least two of these open side-by-side. Reflectivity for structure; velocity for danger.
Anatomy of a Landfalling Hurricane on Radar
When a hurricane’s outer shield hits radar range, the picture can look deceptively simple—a huge blob of green and yellow. But zoom in and you can read the whole storm’s machinery.
The Outer Bands: Where the Hidden Tornadoes Live
Outer rainbands curve in like long, crooked arms. In those bands, we look for:
- Kinks in Reflectivity – Small hooks or notches.
- Tight Velocity Couplets – Adjacent pixels of strong inbound/outbound velocities.
These are the signatures of tropical tornadoes—often rain-wrapped, invisible, and fast. While the media fixates on the eye, we’re dodging these banded assassins on country roads miles inland.
The Inner Core: Eyewall and Eye
As the storm closes in, the radar reveals:
- Eyewall – A thick ring of high reflectivity (reds) encircling a region of low returns.
- Moat – Lower-reflectivity gap during eyewall replacement cycles.
- Eye – The calm center, often with faint ground clutter or light rain.
When I see a clean, symmetric eyewall tightening up with high DBZ and strong velocity gates, I know we’re dealing with a well-organized, dangerous core. That’s when we make the final call: stay on the weak side, or reposition toward the stronger quadrant if conditions and roads allow.
Radar Limits: Where the Beam Lies to You
Radar is powerful, but it’s not omniscient. Chasers who survive respect its blind spots.
Beam Height and Curvature
Radar beams curve upward with distance from the site. At 150+ miles, you’re sampling the storm thousands of feet above the surface.
That means:
- Surface winds can be stronger (or weaker) than what you see.
- Low-level rotation (like tornadoes) might be poorly sampled far from the radar.
Blocked and Attenuated Beams
Heavy rain and terrain can attenuate or partially block the signal. A gap in echo doesn’t always mean a gap in rain.
Range Folding and Velocity Limits
In intense winds, velocity fields can alias (wrap around) and show strange values. We’ve chased storms where the true wind speed exceeded the radar’s unambiguous velocity range—on screen, it looked weaker than reality.
The takeaway: Trust radar as guidance, not gospel. Combine it with real-world observations: how your vehicle shakes, how debris moves, what nearby surface stations report.
Field Strategy: How We Position Using Radar
When the eyewall nears, you have three priorities: max data, max view, max survivability.
1. Pick Your Quadrant
In the Northern Hemisphere, the right-front quadrant relative to motion usually holds the most intense winds and worst surge. Chasers often aim for:
- Just inside or near the edge of the right-front quadrant for extreme wind footage.
- The left-front quadrant for a slightly less violent intercept with safer escape options.
Radar helps define those zones precisely instead of relying on rough compass directions.
2. Watch for Eyewall Replacement Cycles (ERCs)
A shrinking inner eyewall on radar, with a developing outer ring, signals an eyewall replacement cycle. During an ERC:
- Peak winds may temporarily weaken.
- The wind field usually expands, spreading dangerous conditions farther out.
Chasers use this window to reposition. Locals can misread this as, “The storm is weakening; we’re fine now.” Then the new eyewall matures and slams them harder than before.
3. Time the Passage of the Eye
The eye on radar is hypnotic—a hollow void in the chaos. We use it to:
- Estimate how long we’ll be in the calm.
- Decide if it’s safe to relocate during the lull.
But the back eyewall can be worse than the front. I’ve seen people step outside to “check the damage” during the eye only to be nearly caught outside when the backside roared in faster than expected.
Radar countdowns that transition from quiet blue to explosive red are the only warning they got.
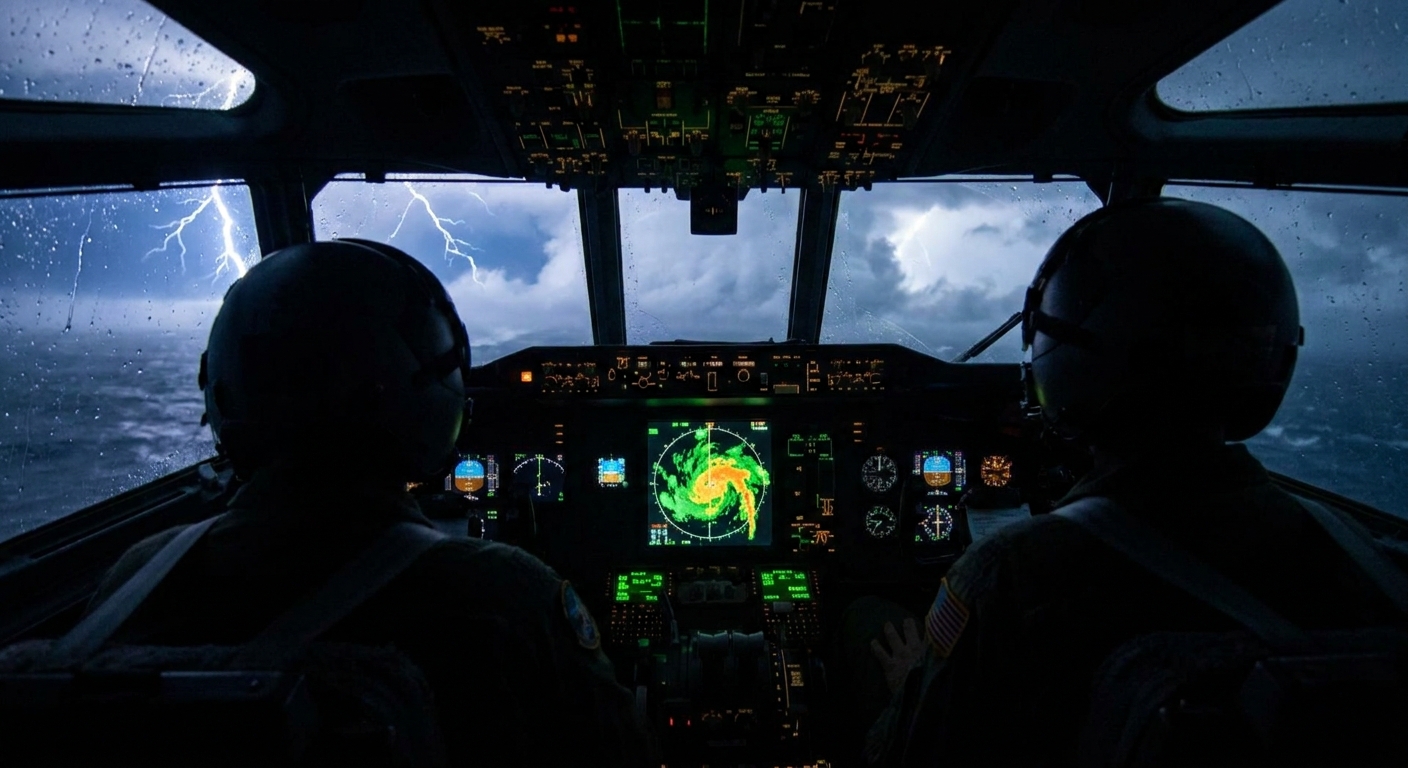
Hurricane Tracking Beyond Radar: The Full Sensor Web
On the best nights, our radar feed is only one input in a dense web of data.
Aircraft Recon
- Dropsondes reveal vertical wind, temperature, and pressure profiles.
- Vortex messages pinpoint the center’s position and strength.
They help us know if the storm is still intensifying even as it nears shore.
Surface Stations and Mesonets
- Coastal sensors report real-time wind gusts, pressure falls, and surge.
- When nearby stations start plummeting in pressure, we know the core is close even if radar beam height is working against us.
Lightning Data
- While mature eyes often show less lightning, vigorous outer bands and strengthening cores can light up on lightning networks.
- Bursts of lightning in the inner core can hint at rapid deepening.
We blend all of this into a mental 3D model of the storm.
Safety Protocols: Using Radar Like a Lifeline
You don’t need to be a chaser to use radar like your life depends on it—sometimes, it literally does.
For Coastal Residents
- Track the outer bands: If a persistent band is training over your area, expect flash flooding and embedded spin-ups.
- Don’t rely on the eye as your cue: The worst winds can hit before or after the eye itself.
- Watch the trend, not just a single frame: Loop the last 30–60 minutes. Is the core tightening? Are bands intensifying over you?
For Inland Communities
- Radar reveals where stalling bands set up. Those are your catastrophic flood zones.
- In the inland right-front quadrant, use velocity products to monitor tornado warnings with extra respect—tropical tornadoes are often shallow but vicious.
A Night I Won’t Forget
We were parked in a church lot, a few miles inland, as a Category 3 hurricane prepared to make landfall. The radar showed a jagged, almost shredded eyewall. Models had hinted at weakening.
Then, in two consecutive scans, the eyewall snapped into a clean circle. Reflectivity jumped. Velocity pixels turned deep crimson and bright green, kissing each other in an unbroken ring.
On the ground, we felt it: the wind tone shifted from loud to primal. We yanked the vehicle nose into the wind, double-checked exits, and radioed the others: “Core tightened. This is about to get real.”
Within minutes, power grids began to fail one after another. The outside world vanished into a screaming blur. Radar was our only window, our only proof that beyond that wall of fury was an ordered structure, an eye, and—eventually—an exit.
When the calm finally arrived and the stars briefly peeked through the stadium wall of clouds, we stepped out into the surreal silence of the eye.
I glanced down at the radar again—already, the backside was coiling in.
We climbed back in and shut the doors.
Final Thoughts: Trust the Radar, Fear the Ocean
Radar is our flashlight inside the beast. It shows us banding, eyewalls, possible tornadoes, and evolving cores in near real time. But it doesn’t show surge heights, wave action, or the raw weight of the ocean being hurled onto land.
So track your next hurricane with a chaser’s obsession:
- Follow the radar loops.
- Learn the language of reflectivity and velocity.
- Respect the blind spots and beam height issues.
Use radar to understand the storm’s anatomy—but never forget that some of the deadliest impacts rise silently off the water, beyond the range of any beam.