There’s a moment, just before sunrise, when the latest advisory drops and the entire Atlantic basin seems to hold its breath. The cone updates, the model suites refresh, and suddenly our phones are glowing with new tracks, new probabilities, new dangers.
Introduction: Living Inside the Cone of Uncertainty
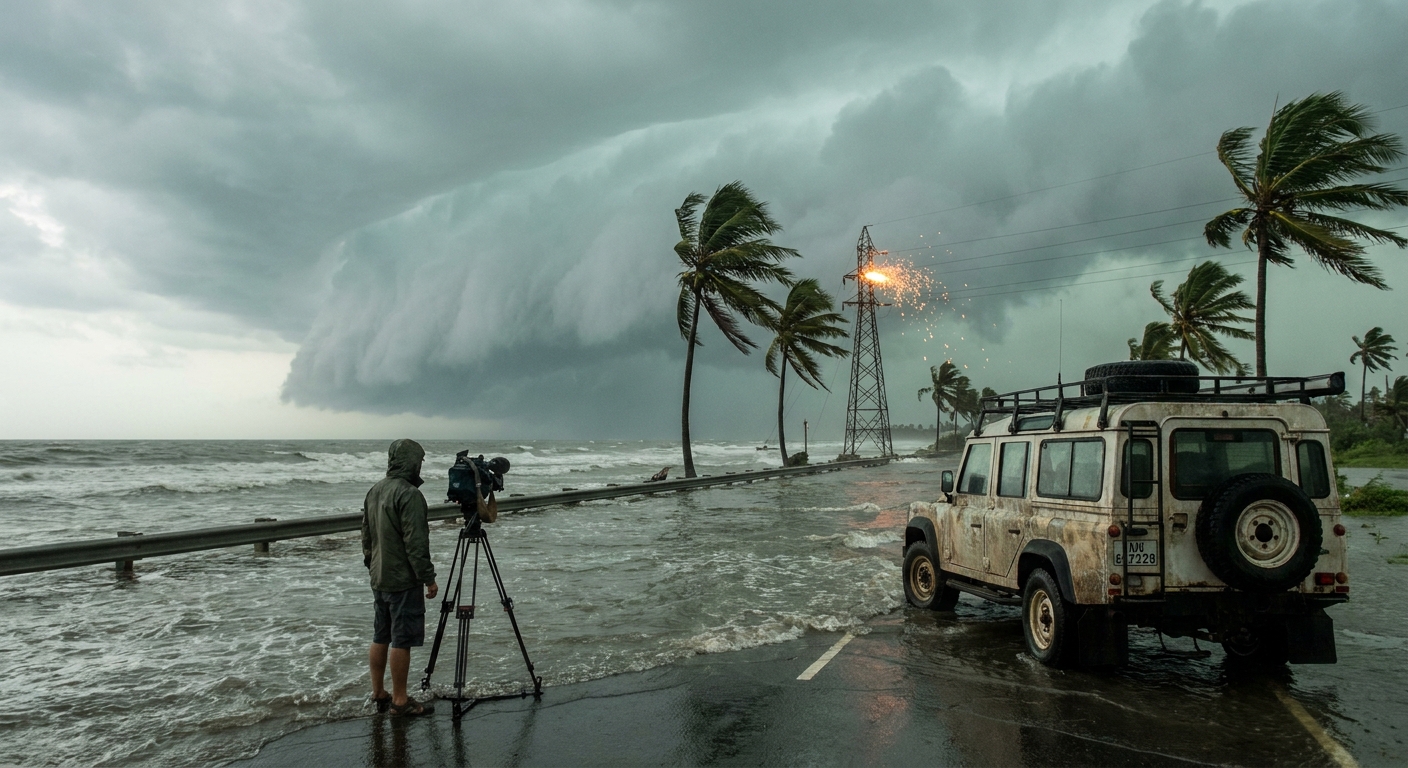
For storm chasers and weather diehards, this isn’t just a graphic on TV. The forecast cone is a living, evolving target zone that we dissect frame by frame, mile by mile. Misreading it can mean the difference between a safe intercept and a deadly trap.
This is how to read hurricane forecasts like someone who’s been out under the eyewall and lived to tell the story.
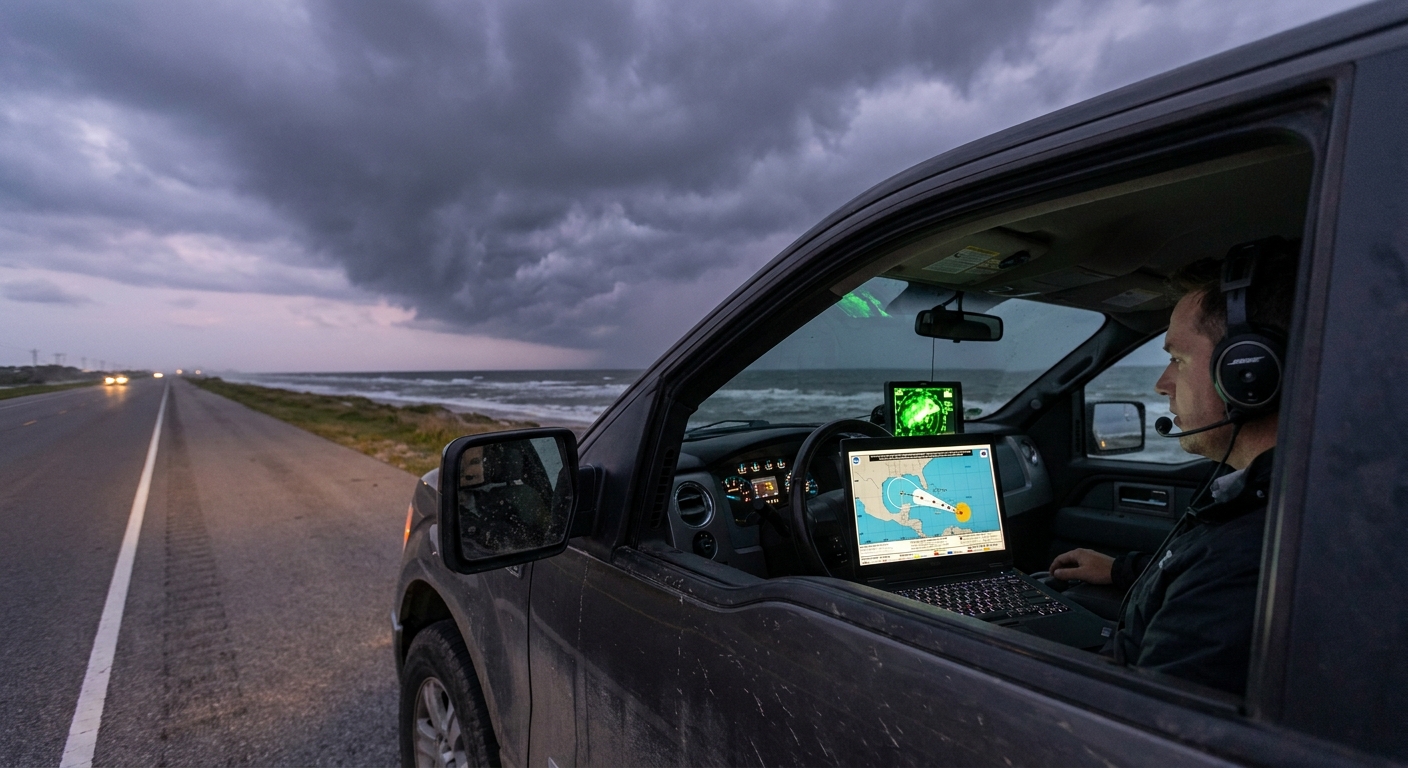
The Core Tools: What Storm Chasers Watch Obsessively
Before we even touch the cone, we need the toolkit:
- NHC Advisories & Discussion – The 5-day cone and official track, but the real gold is in the discussion section where forecasters reveal their doubts and model leanings.
- Spaghetti Models (Ensembles) – GEFS, ECMWF ensembles showing potential spread, critical for understanding uncertainty.
- Intensity Guidance – SHIPS, HWRF/HAFS, and other models for how strong the storm might get.
- Satellite Loops – Visible, infrared, and water vapor for structure and environmental setup.
- Recon Data (Vortex Messages) – Direct aircraft measurements inside the storm.
Every chase day, I build a mental picture: not just where the storm is going, but how confident the atmosphere is in that plan.
The Forecast Cone: What It Really Means (and What It Doesn’t)
The cone is one of the most misunderstood graphics in meteorology.
What the Cone Is
- A historical error envelope: It’s drawn so that, on average, the center of the storm stays within that cone about two-thirds of the time, based on past forecast errors.
- A centerline uncertainty zone: It says nothing about storm size, only center position uncertainty.
What the Cone Is Not
- It is not an impact cone. Destructive winds, flooding rain, and tornadoes can extend far outside the cone.
- It is not a guarantee: A storm can and does wander outside the cone in real life.
- It is not fixed: With every advisory (often every 6 hours), the cone can shift dramatically.
When I chase, I treat the edge of the cone as a suggestion, not a boundary. Impacts routinely blindside people who thought, “We’re outside the cone, we’re fine.”
Reading Between the Lines: The NHC Discussion
If the cone is the headline, the NHC Forecast Discussion is the unfiltered field note.
Things I always look for:
Confidence Language
Phrases like “higher-than-normal uncertainty”, “low confidence in the track forecast”, or “models diverge substantially” are red flags. That’s when I widen my target area.
Model Preference
Forecasters often say things like: “The forecast leans toward the ECMWF solution” or “Track adjusted closer to the TVCA consensus.” When the NHC sides with a particular model or blend, I follow their reasoning more than any one spaghetti plot.
Key Synoptic Features
Look for mentions of: - Subtropical ridges steering west/northwest. - Mid-latitude troughs trying to recurve the storm. - Weak steering currents, which can create dangerous stalls and flooding.
I treat the discussion like a briefing from the lead forecaster before I commit to a chase corridor.
The Spaghetti Plot: Chaos on a Map
Spaghetti plots are mesmerizing: dozens of twisting lines, some diving into the Gulf, others recurving harmlessly out to sea.
How I Read Spaghetti Models
- Cluster Tightness – A tight cluster means higher confidence; a wide, messy spread means chaos. When the spread explodes beyond 3–5 days, I mentally downgrade any long-range plans.
- Outliers – I always note the wild tracks that peel far left or right. One outlier is easy to ignore; a small cluster of similar outliers suggests a competing scenario that might gain traction in later runs.
- Consistency Over Time – I trust models that maintain a similar solution over multiple cycles more than dramatic flip-floppers.
Ensemble Mean vs. Single Runs
The ensemble mean (the average of many runs) often outperforms a single “pretty” deterministic track. On chases, I prioritize corridors where the ensemble clustering is densest, not just where one high-res run draws a perfect intercept.
Radar and Satellite: Real-Time Reality Check
Models promise; radar and satellite verify.
Satellite Clues
- Eye Formation & Symmetry – A clearing, warming eye on infrared means intensification. When I see a perfectly symmetric CDO (central dense overcast), I know we’re dealing with a more stable, powerful core.
- Outflow Channels – Strong poleward or equatorward outflow suggests the storm is efficiently venting, primed to strengthen if other conditions allow.
- Dry Air Intrusions – Fingers of dry air wrapping into the circulation are trouble for intensity, often skewing the convection to one side.
Radar Tells the Truth on Landfall
As coastal radars start sampling the core:
- Eyewall Structure – Double eyewalls or eyewall replacement cycles can shift the max wind field and timing of peak intensity.
- Rainbands – Those spiraling bands carry the tornado threat and localized wind bursts. I never camp near a persistent band on radar.
On one chase, a ragged-looking storm on model output suddenly exploded on radar—tightening eyewall, concentric bands, velocity spikes. The models had underplayed it; the live data didn’t. That’s when we shifted south 40 miles and avoided a direct hit from a rapidly intensifying core.
Safety Protocols: Planning Like a Chaser, Surviving Like a Local
Even if you’re not driving into landfall like we do, you can steal our safety mindset.
1. Respect the Error Bars
- Treat the entire 5-day cone plus a margin as potentially at risk.
- If you’re within 48–72 hours of possible impact, act as if the storm could jog 50–100 miles either way.
2. Time Your Moves, Not Just Your Location
Storm chasers obsess over timing:
- Evacuate early if you’re in surge-prone zones; don’t wait for cone shifts.
- Complete prep 24–36 hours before expected tropical-storm-force winds. Once sustained winds hit 40+ mph, it’s too late to safely adjust.
3. Prepare for Off-Center Impacts
- Outside the cone? You might still see tornadoes, flooding rain, or prolonged power loss.
- Inland? Plan for river flooding 1–3 days after landfall.
Chasers survive by overestimating risk while underestimating our ability to outsmart chaotic systems.
Field Notes: A Chase Inside the Wobble Zone
I remember a Gulf hurricane that wouldn’t choose a landfall. Every advisory wobbled east, then west, then back again. The cone sprawled like a painter’s accident.
We set up on a stretch of coast smack in the middle of the ensemble cluster, not the deterministic line. For 24 hours, the centerline kept shifting away from us, then back toward us.
On radar, an inner eyewall tightened just offshore. The latest NHC discussion hinted at a slight eastward bend due to a weakening ridge – just one sentence, easy to miss.
We nudged 30 miles east.
That small adjustment kept us out of the core’s full fury while still giving us a front-row seat to the eyewall’s northern flank. Nearby towns, still thinking in terms of the previous cone, were blindsided by wind and surge that “wasn’t supposed to be this bad.”
They were trusting a static picture. We were chasing a moving target.
Putting It All Together: A Hurricane-Tracking Playbook
When I track a hurricane, my mental checklist looks like this:
- Start with the NHC cone – Note centerline, width, and timing.
- Read the discussion twice – Extract confidence, steering, and model lean.
- Scan the ensembles – Look for clustering and outliers.
Watch the trend – Is the cone drifting one way over multiple advisories?
Verify with satellite and radar – Is the storm behaving as forecast?
6. Plan for the wobble – Assume realistic jogs of 25–50 miles near landfall. 7. Act early – Evacuate and prep according to worst credible scenarios, not best hopes.
Hurricane tracking isn’t just consuming graphics; it’s reading an unfolding story written in pressure fields, steering currents, and convective bursts.
Once you start seeing the cone as a living, breathing probability envelope instead of a simple path, you’re thinking like a storm chaser. And in the face of a landfalling hurricane, that mindset might be the most powerful tool you have.